flowchart TB
  A["Edit the shader"] --> B["params: camera and phase<br/>for 12 moments in time"]
  B --> C["render.swift: offscreen render<br/>12 PNGs + GPU time"]
  C --> D["montage: a 3×4 sheet"]
  D --> E{"Look"}
  E -->|"bad"| A
  E -->|"suspicious"| F["1:1 crop"]
  F --> A
Six iterations to a picture: debugging a shader without a screen
Part 3. An offscreen renderer, contact sheets, and a detective story about banding
Demoscene
Computer graphics
Debugging
The first version of the nebula was overexposed cotton wool filling the whole screen. How an offscreen renderer that writes PNGs and a sheet of 12 frames turned “looks better, I think” into a measurable process, and why you should look at pixels 1:1.
NoteWhere we are
In part 2 we assembled the nebula shader and showed clean frames. Today we go behind the scenes: what those frames looked like at first, and the tool we used to get them right.
The problem: you cannot debug a shader with print
A fragment shader has no println!. It runs a million times per frame on the GPU, and all it can report is a pixel color. Meanwhile the demo lasts 150 seconds and has five scenes. The loop of “tweak a constant → run → wait for the right scene” takes minutes, and comparisons are made from memory.
We needed a way to see all scenes at once in a single action and compare them with the previous version. We built it from three small tools.
Tool 1. A parameter calculator
The shader receives eight numbers from the CPU, and some of them, such as the camera position cam_z and the scene phase, are computed by Rust code in lib.rs. The offscreen renderer must get exactly the same numbers, or we would be debugging a different demo. So the calculator is a tiny separate crate that depends on the demo library:
params/src/main.rs
use star_fabric_64k::*;

fn main() {
    let core = camera_z(82.0);                 // where the core star sits
    for a in std::env::args().skip(1) {
        let t: f32 = a.parse().unwrap();
        let f = timeline(t);
        println!("{} {} {} {} {}", t, camera_z(t), f.phase, f.intensity, core);
    }
}
cargo run -q --release -- 2 8 16 24 36 48 62 74 80 84 100 135 > params.txtparams.txt (excerpt)
36 6.4996853 1 0.8 56.600906
80 55.00081 2 0.9 56.600906
100 93.0012 3 1 56.600906
Tool 2. An offscreen renderer in Swift
The second tool is a command-line Swift program of about 60 lines. It compiles the same .metal file, renders into a texture instead of a window, saves a PNG, and measures GPU time. Swift was chosen because its Metal API is the most concise, and the tool never ships with the demo.
render.swift (the essentials)
let lib = try dev.makeLibrary(source: src, options: nil)        // the same shader source
let pd = MTLRenderPipelineDescriptor()
pd.vertexFunction = lib.makeFunction(name: "vs")
pd.fragmentFunction = lib.makeFunction(name: "fs")
pd.colorAttachments[0].pixelFormat = .bgra8Unorm_srgb
let pso = try dev.makeRenderPipelineState(descriptor: pd)

for line in params {                                            // one line = one frame
    var p: [Float] = [Float(W), Float(H), t, camZ, phase, fade, coreZ, 0]
    var ms = 1e9
    for _ in 0..<5 {                                            // best of 5 runs
        let cb = queue.makeCommandBuffer()!
        let e = cb.makeRenderCommandEncoder(descriptor: rp)!
        e.setRenderPipelineState(pso)
        e.setFragmentBytes(&p, length: 32, index: 0)            // the same 32 bytes of Params
        e.drawPrimitives(type: .triangle, vertexStart: 0, vertexCount: 3)
        e.endEncoding(); cb.commit(); cb.waitUntilCompleted()
        ms = min(ms, (cb.gpuEndTime - cb.gpuStartTime) * 1000)
    }
    // ... texture.getBytes → CGImage → PNG
}
TipWhy best of five
The first run includes warm-up: the GPU leaves its power-saving state and the driver finishes loading the pipeline. The minimum of several runs reflects the cost of the shader itself more honestly.
Tool 3. A contact sheet
Twelve separate PNGs are awkward to compare. ImageMagick’s montage stitches them into one grid:
montage f/t*.png -tile 3x4 -geometry 640x360+2+2 -background '#222' sheet.pngThe command takes every t*.png and lays them out as a 3×4 grid of 640×360 cells, 2 pixels apart, on a dark background. The result is one image that shows the whole demo, from the first frame to the finale.
Iterations
Every sheet shows the same 12 moments, row by row from top to bottom: the approach, the entry, the core, the flow, and the finale. Switch between the tabs:
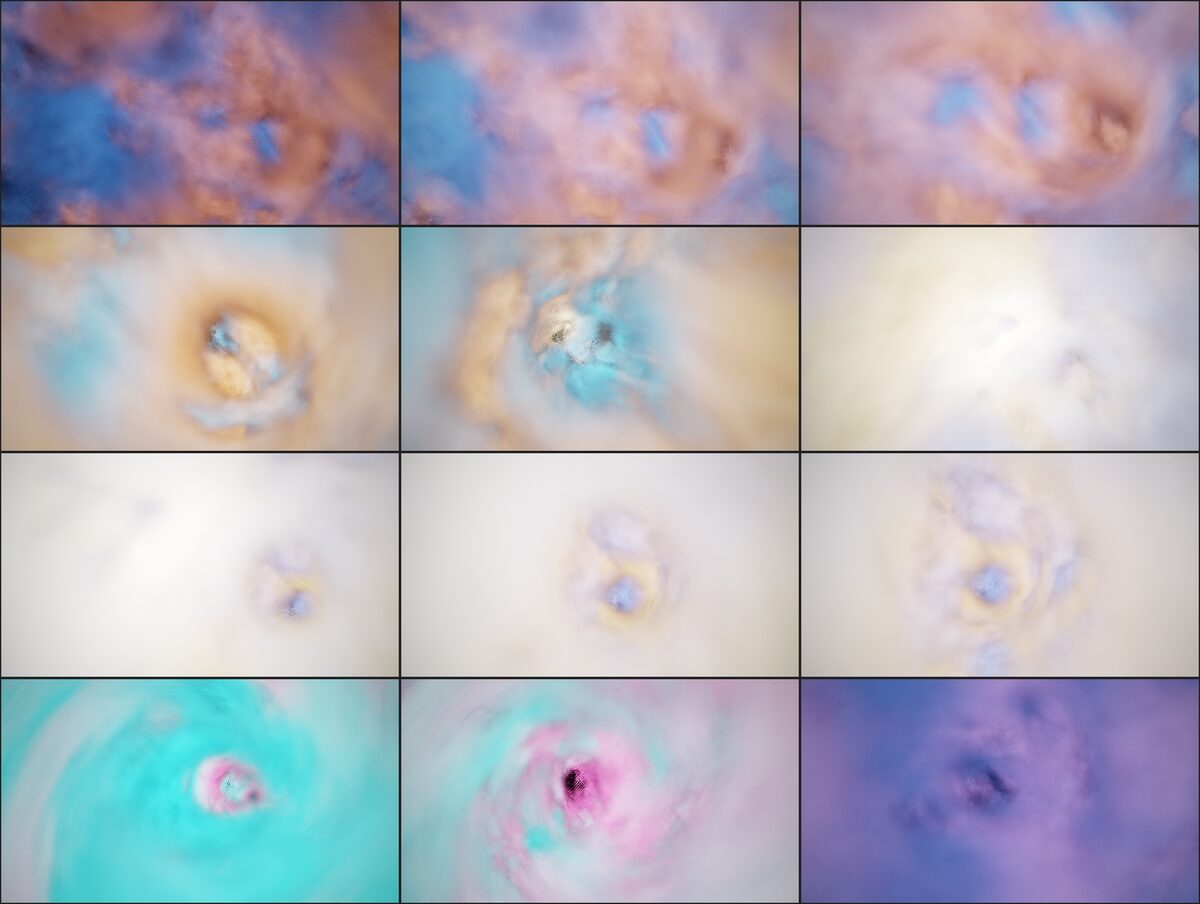
Diagnosis. Three causes at once:
- emission did not depend on whether the gas was thin or dense:
base * (0.25 + 1.6 * smoothstep(0, 0.7, d)), so the denser, the brighter; - the cloud had no outer boundary, so the gas extended forever in every direction;
- the noise threshold
n − 0.42was below the average value of fbm (about 0.47), so more than half of space was filled with gas.
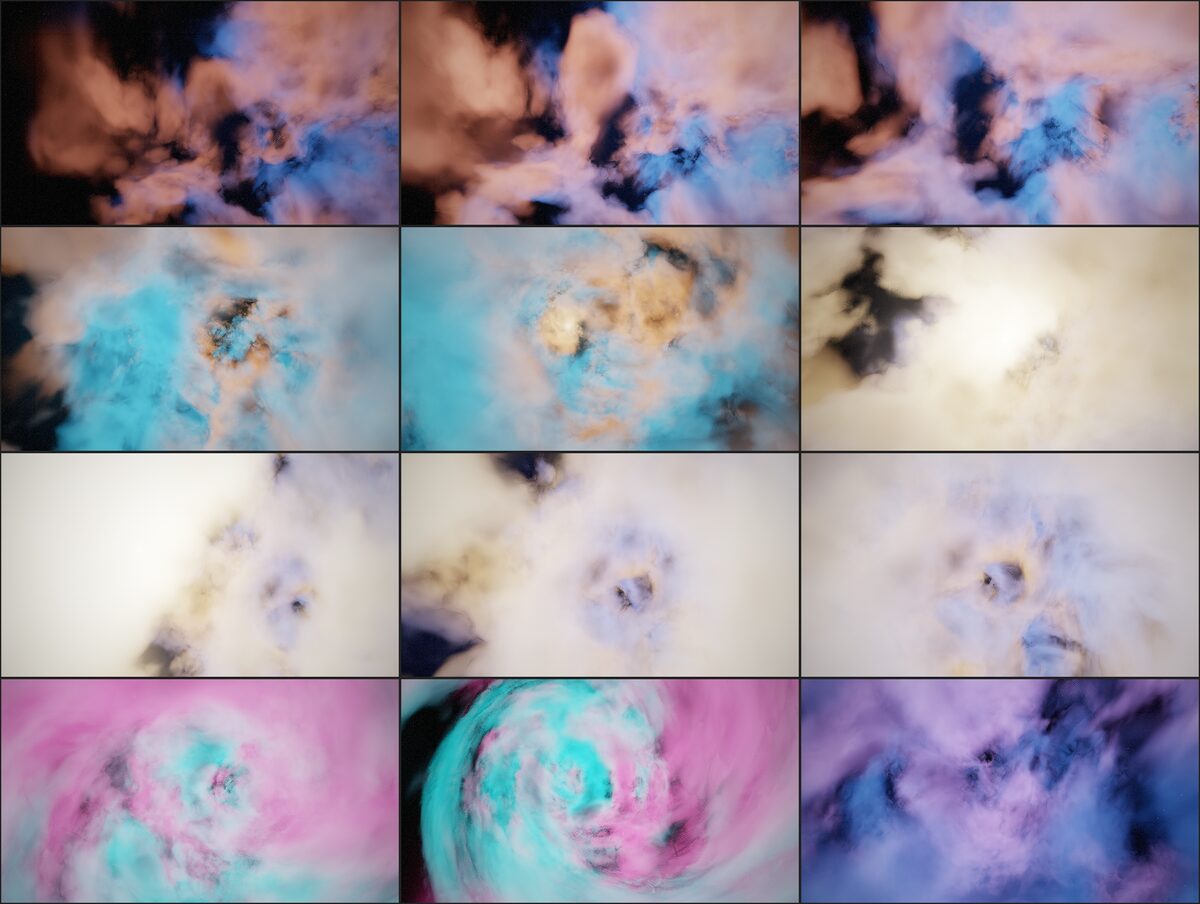
What changed. The key idea of the whole nebula: thin gas glows, dense cores are dark dust. Plus the threshold n − 0.5 and a tube-shaped cloud of radius 13. Plus texture noise instead of hash noise (see part 4).
float rim = smoothstep(0.0, 0.15, d) * (1.0 - 0.7 * smoothstep(0.15, 0.8, d));
float3 e  = base * (0.08 + 0.9 * rim) * (1.0 - 0.9 * dark);
What remained. Overexposure. And the first scene did not work: the camera already sat at the cloud, when the intent was for the nebula to drift out of the darkness.
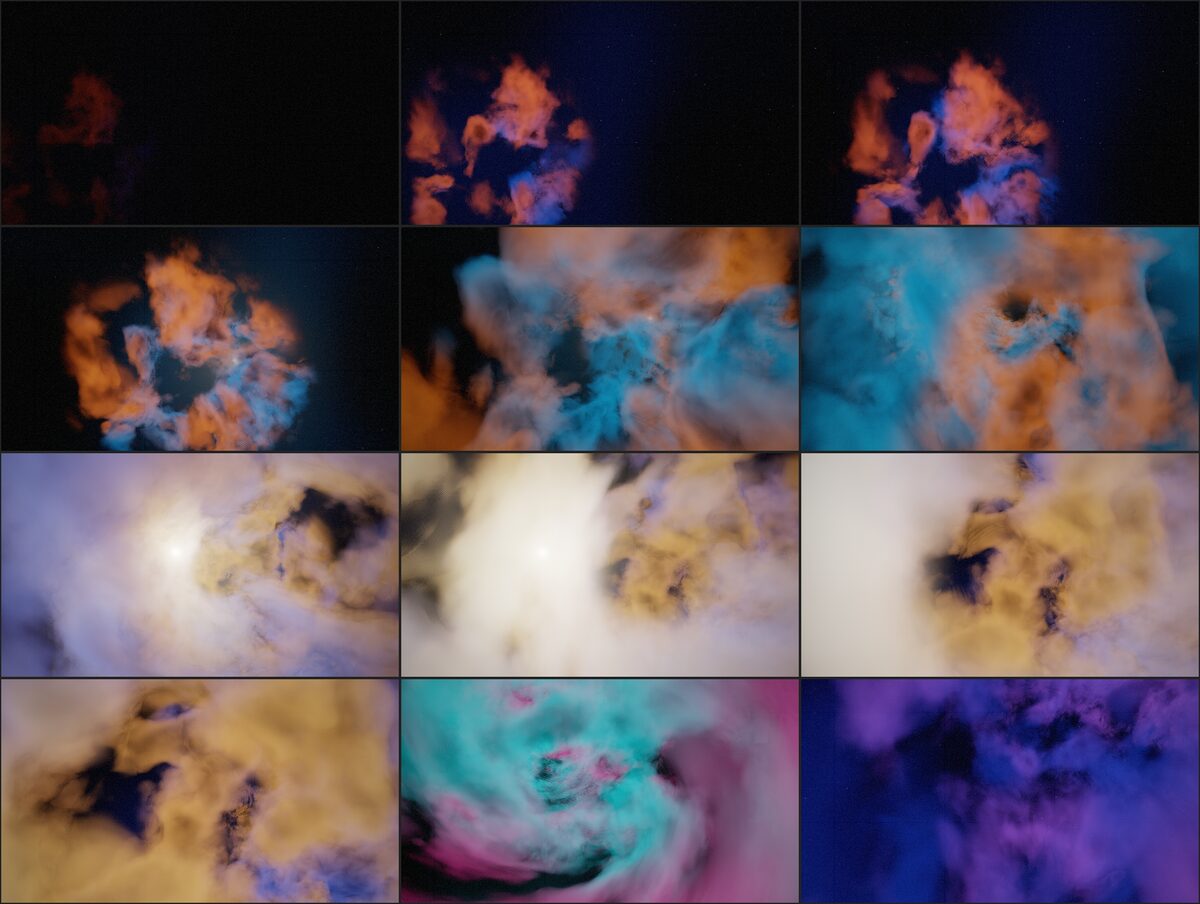
What changed.
- Emission weakened 2–3×:
0.03 + 0.45 * rim. - A saturated palette, with no “gray” mixed into the channels.
- The cloud tube narrowed to a radius of 11.
- The camera now starts at
z = −25, far in front of the cloud, and flies faster in the first scene (0.6 instead of 0.4).
What remained. The “core” scene: the star floods half the screen with white.
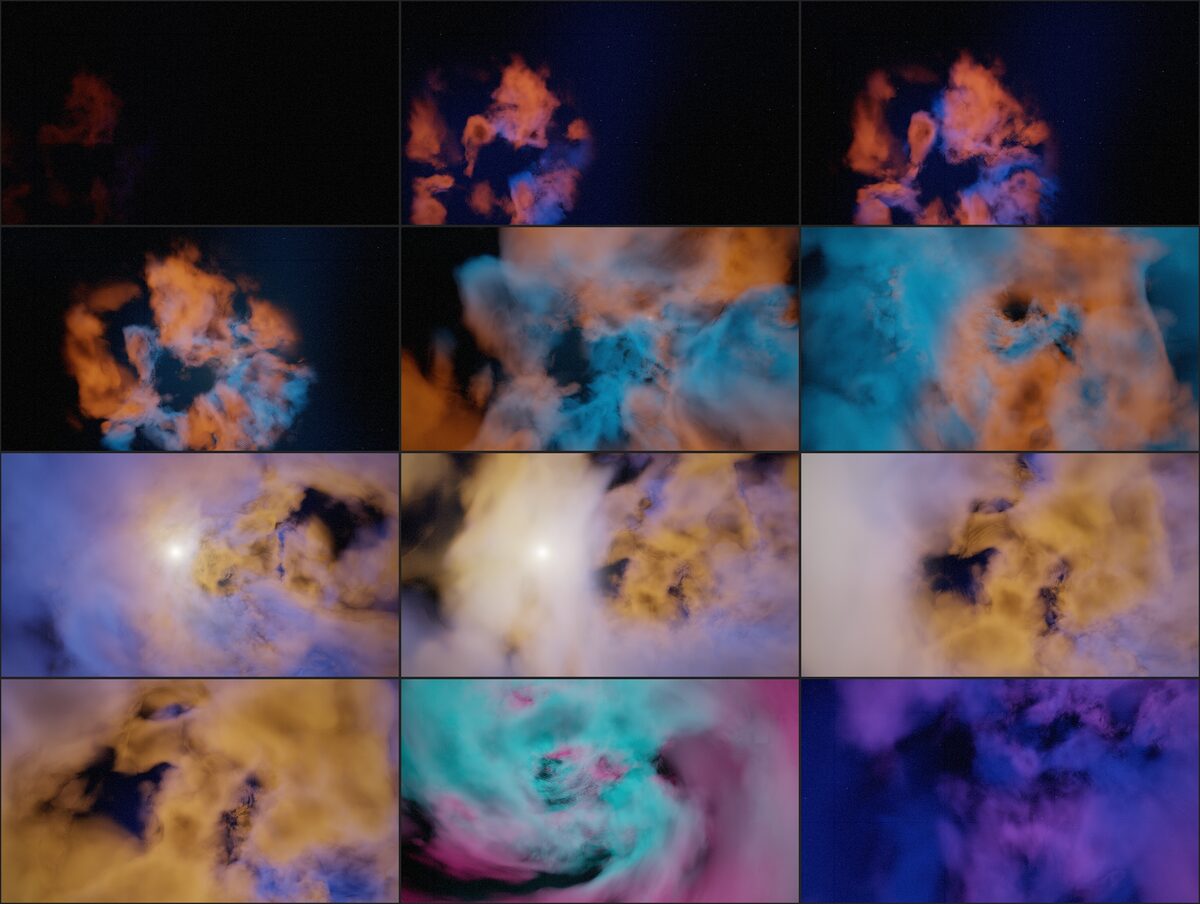
What changed. How strongly the star lights the gas, and the star’s halo:
float lit = s.core * 1.2 / (1.0 + dot(L, L) * 0.5);   // was 10.0 / (1 + L²·0.3), then 3.0
col += ... * (0.0003 / (ang * ang + 0.00004) + 0.2 * exp(-ang * 10.0));   // was 0.0004 and 0.5·e^(−8a)
The whole evolution in one table:
| Parameter | v1 | v2 | v3 | v4 |
|---|---|---|---|---|
| Noise | hash, ALU | R8 texture | R16 texture | R16 |
| Density threshold | (n−0.42)·3 |
(n−0.5)·4 |
← | ← |
| Cloud radius | ∞ | 6 → 13 | 5 → 11 | ← |
| Gas emission | 0.25 + 1.6·s(d) |
0.08 + 0.9·rim |
0.03 + 0.45·rim |
← |
| Star lighting | 10 / (1 + 0.3L²) |
← | 3 / (1 + 0.3L²) |
1.2 / (1 + 0.5L²) |
| March steps | 72 | 64 | 64 | 64 |
| Camera start | z = 0 | z = 0 | z = −25 | ← |
| Outcome | cotton wool | volume, overexposed | scenes 0/1/4 done | final |
The banding mystery
In the bright areas of the v2–v4 sheets we noticed contour bands, like the level lines on a map. The suspect was obvious. By then the noise came from a texture with 8 bits per value, that is, 256 levels. The noise passes through a threshold and a multiplication by 4, so small steps could become visible.
We switched to a 16-bit texture. The bands on the sheet stayed.
So we cut out a piece of a frame at its actual size:
No bands. They were produced by the downscaled preview of the sheet, not by the shader. Shrinking a large image with smooth gradients creates steps, and we had mistaken them for a rendering defect.
ImportantThe moral
Before fixing an artifact, make sure it exists in the pixels at 1:1, not in a preview, compression, or a screenshot.
WarningAn honest caveat
We switched to R16 before finding the real cause. We never ran a separate experiment to check whether the 8-bit texture produced steps of its own. There is a reason to suspect it: after the threshold and the ×4 scaling, a 1/256 step of the first octave becomes almost 1% of density. But we have no proof, and we will not present a guess as a result.
What the tool gave us
| Before | After |
|---|---|
| Run the demo, wait for the right scene | 12 scenes on one sheet in seconds |
| Compare from memory | Before and after sheets side by side |
| “Feels faster” | GPU time per frame, best of 5 |
| A suspected artifact | A 1:1 crop |
The whole toolkit is about 60 lines of Swift and 15 lines of Rust, and it saved dozens of blind runs. In the next part we use it to measure the demo’s biggest speedup.
Series: Demoscene 2026
Part 3 of 7 · suggested reading order
Previous: A nebula from nothing: volumetric ray marching in one fragment shader
Next: Noise in one fetch: a 3D texture instead of eight hashes
References
[1]
Apple Inc. Metal: render advanced 3D graphics and perform data-parallel computations using graphics processors. https://developer.apple.com/documentation/metal
[2]
ImageMagick Studio LLC. montage: create a composite image by combining several separate images. https://imagemagick.org/script/montage.php