flowchart LR
  C[llama-cli]
  A[rpc-a]
  B[rpc-b]
  Q[egress netem]
  C -->|RPC| A
  C -->|RPC| B
  A -->|reply| C
  B -->|reply| Q
  Q -->|0% to 5% loss| C
At 128 tokens, loss slowed llama.cpp RPC down a slope, not off a cliff
Experiments
Distributed systems
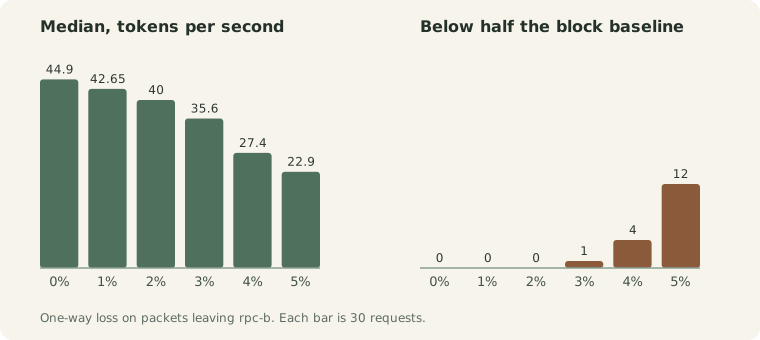
With generation fixed at 128 tokens, median speed fell from 44.9 to 22.9 tok/s between 0% and 5% one-way loss. Twelve of 30 requests at 5% ran below half their block baseline, and every request still exited 0.
NoteWhat this note is
This note continues the short-request campaign. Generation is now fixed at 128 tokens, and loss is measured at every whole percent from 0 to 5. The numbers below are from one laptop and one llama.cpp build.
Why hold the length
Yesterday the model could finish as soon as it had said “Paris.” A two-token answer makes a wild tokens-per-second figure, because the clock barely starts. --ignore-eos keeps the sampler from treating end-of-text as a reason to quit, and -n 128 tells the client to produce that many tokens anyway. Everything else stayed put: llama.cpp RPC v0.4.1, Qwen2.5-0.5B on CPU, two workers, loss only on packets leaving rpc-b (llama.cpp contributors 2026) (Linux man-pages project 2024).
We were looking for the smallest loss at which many requests fall below half speed while the program still calls them a success.
Ten blocks mixed the six loss settings in an order chosen before the run, with three requests at each setting. Slow meant under half the no-loss median from the same block, or a failure, and that definition was not adjusted afterward.
llama-cli --single-turn --ignore-eos \
  -m /models/qwen2.5-0.5b-instruct-q4_k_m.gguf \
  --rpc rpc-a:50052,rpc-b:50052 \
  -n 128 -p "The capital of France is" --no-display-prompt
Half of baseline is a yardstick, not a discovery. The laptop’s quiet speed was not perfectly steady, so a request at 4% loss is judged against the clean runs in its own block. “Silent” is narrower still. Silence here means exit code 0, no timeout, and no log line about loss, retry, a timeout, or a bad RPC path. The harness knew the queue was dropping packets; llama.cpp did not say so.
A ramp, then the numbers
Here is the shape, before the table argues about it. Median rate steps down at every extra percent. Under the half-speed line, the count refuses to follow. It stays at zero through 2%, ticks once at 3%, then rises at 4% and 5%. A cliff would have been a flat field and then a wall. This is a ramp that gets steeper.
| Egress loss | Requests | Median, tok/s | p10, tok/s | Range, tok/s | Median latency, s | p90 latency, s | Slow | Failed |
|---|---|---|---|---|---|---|---|---|
| 0% | 30 | 44.90 | 40.95 | 27.30–49.30 | 4.869 | 5.406 | 0/30 | 0/30 |
| 1% | 30 | 42.65 | 37.03 | 34.90–47.90 | 5.234 | 6.382 | 0/30 | 0/30 |
| 2% | 30 | 40.00 | 33.40 | 32.00–48.80 | 5.949 | 6.814 | 0/30 | 0/30 |
| 3% | 30 | 35.60 | 27.10 | 23.00–47.60 | 6.071 | 7.410 | 1/30 | 0/30 |
| 4% | 30 | 27.40 | 22.27 | 20.70–39.60 | 7.998 | 9.490 | 4/30 | 0/30 |
| 5% | 30 | 22.90 | 18.86 | 15.60–32.60 | 9.462 | 10.888 | 12/30 | 0/30 |
Read the median column as a walk, not a verdict: 44.9 tokens per second with no loss, 42.65 at 1%, 40.0 at 2%, 35.6 at 3%, 27.4 at 4%, and 22.9 at 5%. The slow counts on that same walk are 0, 0, 0, 1, 4, and 12 out of 30. Twelve at 5% is the number that matches yesterday’s question. If you only watched the exit code, the afternoon was boring. None of the 180 requests failed, and none of the slow ones carried an explicit complaint in the client or worker logs. Median latency, which includes loading the model, moved from 4.869 s to 9.462 s. Late arrivals worsened too: the 90th percentile of latency went from 5.406 s to 10.888 s. So both the center and the late arrivals got worse, without anyone printing an error.
The previous campaign, where the reply could stop early, saw 16 of 30 requests under the line at 5% loss, with speeds from 3.2 to 49.0 tokens per second. Holding the length at 128 tokens cut that count to 12 of 30 and squeezed the 5% speeds into 15.6–32.6. The freakish fast success and the near-stall did not come back. What remained is a lower typical rate. Good news would be the wrong label. Circus, in the earlier note, meant one request at 49.0 tokens per second and another at 3.2 under the same 5% setting. Small is the wrong word for a fall from 44.9 to 22.9, which is still about half. The short reply exaggerated the scatter. It did not invent the slowdown.
One nuisance sits in the per-block baselines. The first block’s clean median was 33.3 tokens per second, and the other nine sat between 42.4 and 48.6. Because each request is scored against its own block, a low clean median makes lossy runs look relatively faster, not slower. The requests that crossed the line are spread through later blocks. There is no separate measurement that explains the slow first block. It is recorded so it cannot quietly become the plot. Warmup, contention, or plain luck are all still available, and none of them was tested.
What we wanted to find out
- Does a fixed length keep the slow tail? Yes. At 5% loss, 12 of 30 requests fell below half their block baseline. At 0%, none did. The median falls from 1%. The half-speed count stays zero until 3%.
- Do those slow requests match TCP retransmissions? Not measured. A smooth curve does not justify that study next.
- Does a second runtime do the same? Not tested.
- Does a queue fatten the tail faster than the loss rate? Not measured.
Series: Packet loss on llama.cpp RPC
Part 2 of 2 · suggested reading order
Previous: At 5% packet loss, 16 of 30 llama.cpp RPC requests fell below half their baseline
References
Linux man-pages project. 2024. Tc-Netem(8) — Network Emulator. Https://man7.org/linux/man-pages/man8/tc-netem.8.html.
llama.cpp contributors. 2026. Llama.cpp. Https://github.com/ggml-org/llama.cpp.